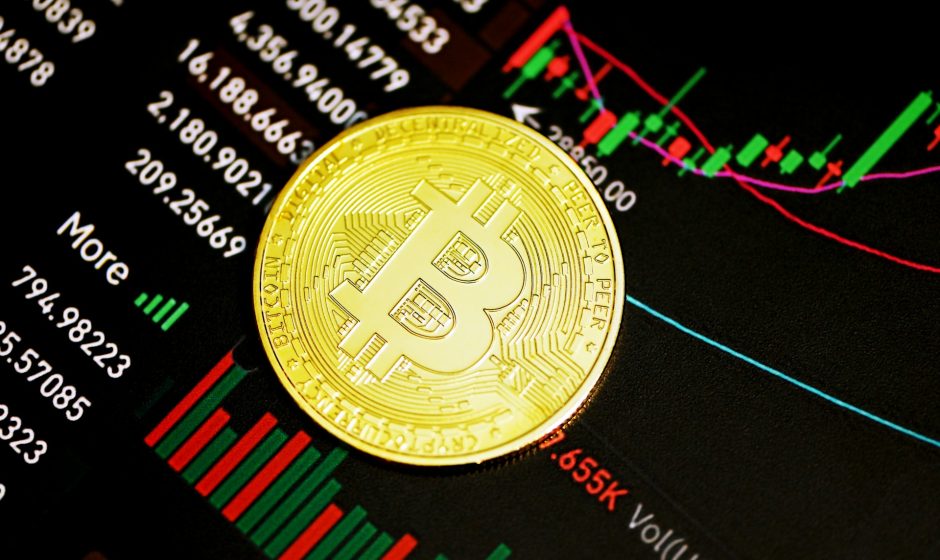

- Understanding Bitcoin price
Example (illustrative prices):
| Bitcoin price | Meaning |
| $90,000 | Current price |
| $91,000 | Price increased |
| $92,000 | Price increased further |
| $89,000 | Price decreased |
| $88,000 | Price decreased further |
If Bitcoin moves from $90,000 to $92,000:
- Increase: $2,000
- Percentage increase: 2.22%
- Understanding candlesticks
There are two basic candle types:
- Green: Closing price is higher than opening price.
- Red: Closing price is lower than opening price.
Example:
| Candle | Open | High | Low | Close |
| Green | $90,000 | $92,000 | $89,500 | $91,500 |
| Red | $91,500 | $92,000 | $89,000 | $90,000 |
- Understanding trends
| Market direction | What to look for |
| Bullish | Higher highs and higher lows |
| Bearish | Lower highs and lower lows |
| Sideways | Price moving within a range |
- Support and resistance
Example:
- Support: $88,000
- Resistance: $95,000
- Current price: $91,000
Support is an area where buyers previously entered.
Resistance is an area where sellers previously entered.
Neither guarantees that the price will reverse.
- Understanding volume
- High buying volume: Strong trading activity during a price rise.
- High selling volume: Strong trading activity during a price fall.
- Low volume: Less trading activity.
- Five things to check every time you read Bitcoin’s chart
- Current BTC price in USD.
- Whether the price is going up or down.
- Whether the market is bullish or bearish.
- Where support and resistance are located.
- Whether trading volume is increasing or decreasing.
Important: Charts help you understand market behaviour, but they cannot guarantee future Bitcoin prices.